Effective Planning Starts with Knowing Who Is Available And When
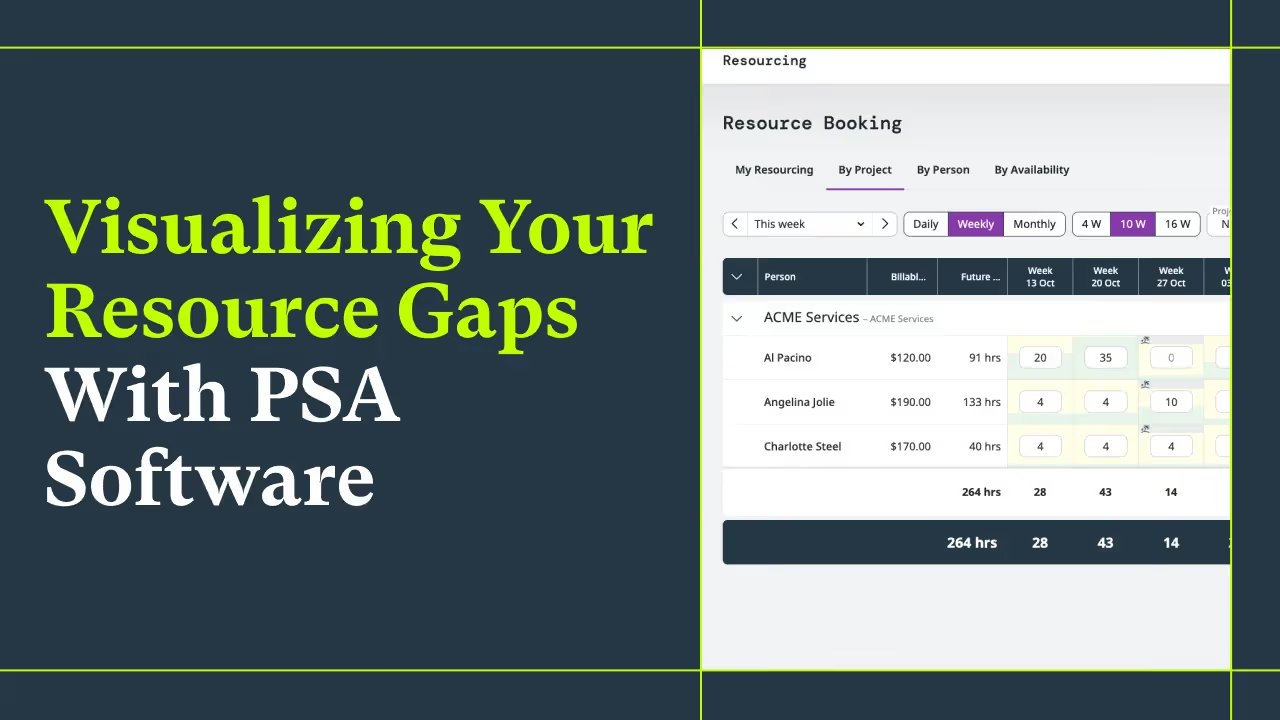



Learn how resource planning software like Projectworks can help you visualize resource availability and maximize your firm’s utilization.
Increasing your resource utilization is the most effective way to simultaneously increase revenue and profit for your consulting firm. However, most firms that still use spreadsheets to manage their operations tend to focus only on increasing revenue (getting new clients), and neglect the resource utilization metric. This leads to higher revenue with lower profits and increased stress on your team.
The benchmark resource utilization percentage for a high-performing consulting firm is about 80%. This means 80% of your consultant’s time is spent on billable work. So the path to a higher utilization percentage seems simple: Make sure all of your consultants are steadily working on billable projects.
This is where it gets tricky for smaller firms who track time and progress on spreadsheets. How do you know who will be available next week for a 10 hour project? Or next month for a 20 hour contract we just signed today?
On top of that, do you know if your star performers are being overworked? Your best consultants by nature will often downplay the early signs of burnout. And your other team members will always tell you they are busy because no one wants to seem expendable.
Visualization Tools In A Spreadsheet Do Not Work
Managing the complexity of multiple consultants working on multiple projects spanning weeks or months is asking too much of spreadsheets. While spreadsheets are great for tabular data, you need to visualize each consultant’s workload across time to effectively manage the firm’s utilization.
Some firms try to format their spreadsheets for visual resource management, spending hours formatting cells and linking data sources, only to see their formatting break when they add a new row, or when they need to see a different time frame.
Managing Your Resources Visually
PSA Software like Projectworks is built to enable firms to easily manage their resource allocation using integrated time tracking and project data. The interface is interactive, enabling you to drag and drop projects or work from one row (consultant) to another to balance the consultant’s workload and ensure projects are completed on time. And since the project data is linked to your time tracking data, your view is always up to the minute accurate, giving you the confidence to confirm capacity quickly and increase your overall utilization.
You can see for yourself how efficient managing your resources can be with a free trial of Projectworks, or let us demo Projectworks for you, and show you how switching from spreadsheets to software can help you increase revenue and profit at the same time.


Read similar resources from Projectworks

E-invoicing sends invoices straight into your client's finance system via Peppol. Here's what NZ and Australian firms need to know and fix first.

Most pipeline coverage advice is written for SaaS. Here's how a consulting firm sets coverage by deal stage and plans for the clients it will lose.

Let’s say a consulting firm signs a $30,000 engagement in July and invoices the full fee upfront. The client pays quickly and the cash lands, but the work runs from July through September. By the end of July the firm has completed about one-third of the engagement - the project’s on track but the finance team have some work to do to match revenue with the costs incurred (the “matching principle” of having costs and revenue in the same period is a key accounting concept). Only a third of the project’s fee has been earned (because only a third of the work has been done), and the remaining $20k of revenue is deferred to a future period.